Covariate Shift Analysis#
![]()

Covariate shift is a phenomenon in machine learning where the distribution of the independent variables in the training and testing data is different. This can occur when the training data and testing data come from different sources, regions or changes over time. This can result in biased model performance, as the model is not generalizing well to the test data.
To address covariate shift, various techniques can be used, such as re-sampling the data, adjusting the model to account for the shift, transforming the data to a form not exposed to the shift (i.e. car year make -> car age) or obtaining additional data to balance the distribution of the independent variables. The goal is to ensure that the model is trained and tested on similar data distributions, so that the model is generalizing well when deployed into production.
Example#
Let’s load the titanic dataset:
import pandas as pd

df_train = pd.read_csv('https://autogluon.s3.amazonaws.com/datasets/titanic/train.csv')
df_test = pd.read_csv('https://autogluon.s3.amazonaws.com/datasets/titanic/test.csv')
target_col = 'Survived'
Now we can perform analysis:
import autogluon.eda.auto as auto

auto.covariate_shift_detection(train_data=df_train, test_data=df_test, label=target_col)
We detected a substantial difference between the training and test X distributions, a type of distribution shift.
Test results: We can predict whether a sample is in the test vs. training set with a roc_auc of
1.0000 with a p-value of 0.0010 (smaller than the threshold of 0.0100).
Feature importances: The variables that are the most responsible for this shift are those with high feature importance:
| importance | stddev | p_value | n | p99_high | p99_low | |
|---|---|---|---|---|---|---|
| PassengerId | 0.476397 | 0.032325 | 0.000003 | 5 | 0.542955 | 0.409839 |
| Name | 0.000203 | 0.000114 | 0.008298 | 5 | 0.000439 | -0.000033 |
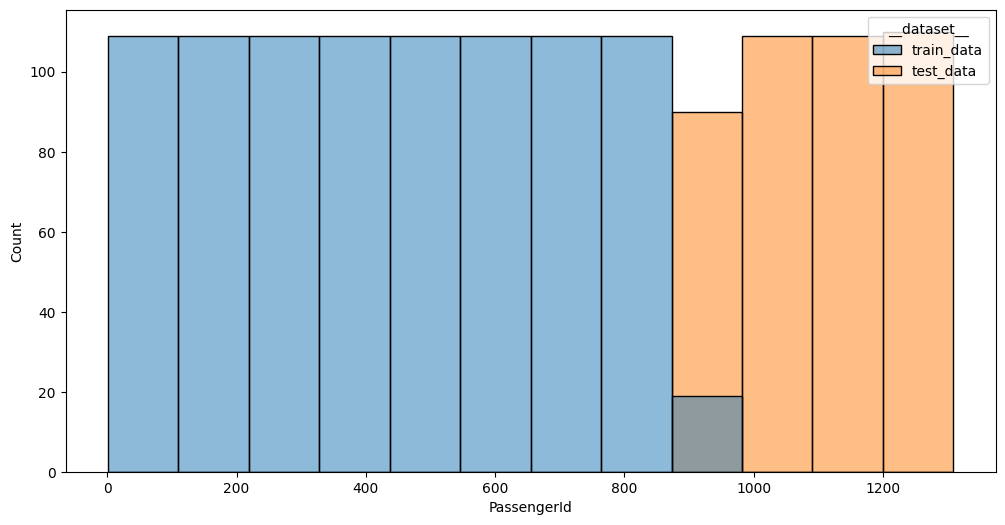
PassengerId values distribution between datasets; p-value: 0.0000
Name values distribution between datasets; p-value: 0.0083
Interaction Name/__dataset__ is not rendered due to Name having too many categories (1307 > 30) for comfortable read.
The detector found that Name and PassengerId with a very high certainty (roc_auc is 1) can distinguish if the
row came from a train or test parts of the dataset. We’ll ignore Name for now - it’s importance is relatively low,
and instead we’ll look first at PassengerId. The graph shows that the feature is uniformly distributed across
different ranges between train and test datasets. In this specific case it is just a monotonically increasing ID,
which carries no practical value for this task. Let’s drop it and try the run again:
df_train = df_train.drop(columns='PassengerId')
df_test = df_test.drop(columns='PassengerId')
auto.covariate_shift_detection(train_data=df_train, test_data=df_test, label=target_col)
We did not detect a substantial difference between the training and test X distributions.