Automated Dataset Overview
In this section we explore automated dataset overview functionality. This feature allows you to easily get a high-level understanding of datasets, including information about the number of rows and columns, the data types of each column, and basic statistical information such as min/max values, mean, quartiles, and standard deviation. This functionality can be a valuable tool for quickly identifying potential issues or areas of interest in your dataset before diving deeper into your analysis.
Additionally, this feature also provides graphical representations of distances between features to highlight features that can be either simplified or completely removed. For each detected near-duplicate group, it plots interaction charts so it can be inspected visually.
Example
We will start with getting titanic dataset and performing a quick one-line overview to get the information.
import pandas as pd

df_train = pd.read_csv('https://autogluon.s3.amazonaws.com/datasets/titanic/train.csv')
df_test = pd.read_csv('https://autogluon.s3.amazonaws.com/datasets/titanic/test.csv')
target_col = 'Survived'
To showcase near duplicates detection functionality, let’s add a duplicated column:
df_train['Fare_duplicate'] = df_train['Fare']
df_test['Fare_duplicate'] = df_test['Fare']
The report consists of multiple parts: statistical information overview enriched with feature types detection and missing value counts.
The last chart is a feature distance. It measures the similarity between features in a dataset. For example, if two variables are almost identical, their feature distance will be small. Understanding feature distance is useful in feature selection, where it can be used to identify which variables are redundant and should be considered for removal. To perform the analysis, we need just one line:
import autogluon.eda.auto as auto

auto.dataset_overview(train_data=df_train, test_data=df_test, label=target_col)
``train_data`` dataset summary
| count | unique | top | freq | mean | std | min | 25% | 50% | 75% | max | dtypes | missing_count | missing_ratio | raw_type | special_types | |
|---|---|---|---|---|---|---|---|---|---|---|---|---|---|---|---|---|
| Age | 714 | 88 | 29.699118 | 14.526497 | 0.42 | 20.125 | 28.0 | 38.0 | 80.0 | float64 | 177 | 0.198653 | float | |||
| Cabin | 204 | 147 | B96 B98 | 4 | object | 687 | 0.771044 | object | ||||||||
| Embarked | 889 | 3 | S | 644 | object | 2 | 0.002245 | object | ||||||||
| Fare | 891 | 248 | 32.204208 | 49.693429 | 0.0 | 7.9104 | 14.4542 | 31.0 | 512.3292 | float64 | float | |||||
| Fare_duplicate | 891 | 248 | 32.204208 | 49.693429 | 0.0 | 7.9104 | 14.4542 | 31.0 | 512.3292 | float64 | float | |||||
| Name | 891 | 891 | Braund, Mr. Owen Harris | 1 | object | object | text | |||||||||
| Parch | 891 | 7 | 0.381594 | 0.806057 | 0.0 | 0.0 | 0.0 | 0.0 | 6.0 | int64 | int | |||||
| PassengerId | 891 | 891 | 446.0 | 257.353842 | 1.0 | 223.5 | 446.0 | 668.5 | 891.0 | int64 | int | |||||
| Pclass | 891 | 3 | 2.308642 | 0.836071 | 1.0 | 2.0 | 3.0 | 3.0 | 3.0 | int64 | int | |||||
| Sex | 891 | 2 | male | 577 | object | object | ||||||||||
| SibSp | 891 | 7 | 0.523008 | 1.102743 | 0.0 | 0.0 | 0.0 | 1.0 | 8.0 | int64 | int | |||||
| Survived | 891 | 2 | 0.383838 | 0.486592 | 0.0 | 0.0 | 0.0 | 1.0 | 1.0 | int64 | int | |||||
| Ticket | 891 | 681 | 347082 | 7 | object | object |
``test_data`` dataset summary
| count | unique | top | freq | mean | std | min | 25% | 50% | 75% | max | dtypes | missing_count | missing_ratio | raw_type | special_types | |
|---|---|---|---|---|---|---|---|---|---|---|---|---|---|---|---|---|
| Age | 332 | 79 | 30.27259 | 14.181209 | 0.17 | 21.0 | 27.0 | 39.0 | 76.0 | float64 | 86 | 0.205742 | float | |||
| Cabin | 91 | 76 | B57 B59 B63 B66 | 3 | object | 327 | 0.782297 | object | ||||||||
| Embarked | 418 | 3 | S | 270 | object | object | ||||||||||
| Fare | 417 | 169 | 35.627188 | 55.907576 | 0.0 | 7.8958 | 14.4542 | 31.5 | 512.3292 | float64 | 1 | 0.002392 | float | |||
| Fare_duplicate | 417 | 169 | 35.627188 | 55.907576 | 0.0 | 7.8958 | 14.4542 | 31.5 | 512.3292 | float64 | 1 | 0.002392 | float | |||
| Name | 418 | 418 | Kelly, Mr. James | 1 | object | object | text | |||||||||
| Parch | 418 | 8 | 0.392344 | 0.981429 | 0.0 | 0.0 | 0.0 | 0.0 | 9.0 | int64 | int | |||||
| PassengerId | 418 | 418 | 1100.5 | 120.810458 | 892.0 | 996.25 | 1100.5 | 1204.75 | 1309.0 | int64 | int | |||||
| Pclass | 418 | 3 | 2.26555 | 0.841838 | 1.0 | 1.0 | 3.0 | 3.0 | 3.0 | int64 | int | |||||
| Sex | 418 | 2 | male | 266 | object | object | ||||||||||
| SibSp | 418 | 7 | 0.447368 | 0.89676 | 0.0 | 0.0 | 0.0 | 1.0 | 8.0 | int64 | int | |||||
| Ticket | 418 | 363 | PC 17608 | 5 | object | object |
Types warnings summary
| train_data | test_data | warnings | |
|---|---|---|---|
| Survived | int | -- | warning |
Feature Distance
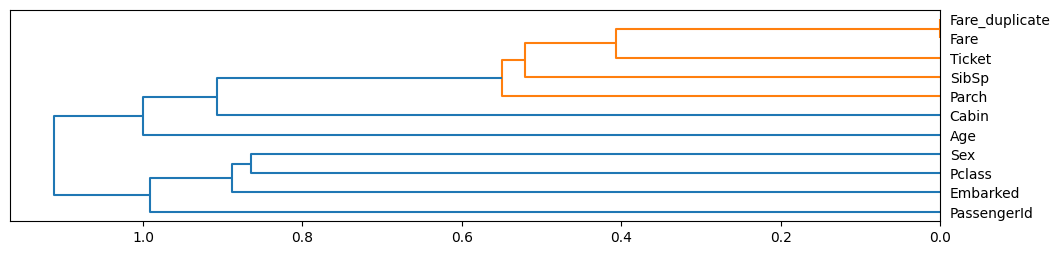
The following feature groups are considered as near-duplicates:
Distance threshold: <= 0.01. Consider keeping only some of the
columns within each group:
Fare,Fare_duplicate- distance0.00
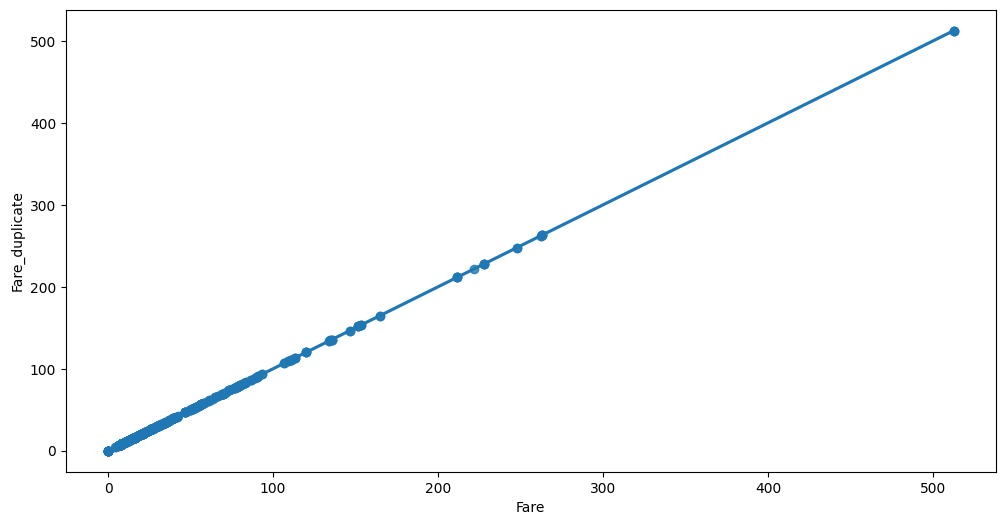
Near duplicate group analysis: ``Fare``, ``Fare_duplicate`` - distance ``0.0000``
Feature interaction between Fare/Fare_duplicate